




Spatial metabolomics data analysis

Spatial metabolomics data analysis
5 March 2027, 9h30-17h00
General context
Understanding the spatial distribution of metabolites, lipids, and proteins is key to uncovering complex biological processes. Mass spectrometry imaging (MSI) makes this possible by enabling direct detection of metabolites, lipids, and proteins from tissue surfaces. In this course, you will learn the different steps required to analyze spatial metabolomics data obtained with MSI.
During the exercise sessions, you will apply these steps in practice, analyzing real MSI datasets with tools such as the Cardinal package in R and IsoScope. By the end of the course, you will be able to explore, process, visualize, and interpret spatial (including tracer) metabolomics data and apply these skills to your research.
- Explain the fundamentals of mass spectrometry imaging (MSI) and its relation to (tracer) metabolomics.
- Describe MS imaging data formats and how to import them into R.
- Apply preprocessing techniques to MSI data using the Cardinal package in R.
- Utilize Cardinal and IsoScope to visualize spatial metabolomics data and perform statistical analyses to detect meaningful patterns.
- Export processed data for downstream analysis.
- Interpret the results of the MSI-based models.
This course combines short lectures with hands-on exercises using real MS imaging datasets. Participants are expected to actively engage with data, follow guided tutorials in R, and contribute to group discussions on data interpretation and analysis.
Unless you are already familiar with MS imaging, we strongly recommend that you first attend our Tracer Metabolomics course. Experience with programming in R is required. If you have no experience with R, you can join our free online R introduction course.
This course is part of the learning path Spatial metabolomics data.
AI methods used
This course applies unsupervised machine learning and statistical learning methods embedded in spatial metabolomics tools such as Cardinal, including dimensionality reduction (e.g. PCA) and spatial clustering algorithms to identify patterns and segment tissue regions based on molecular signatures.
Trainers
Marco Giampà
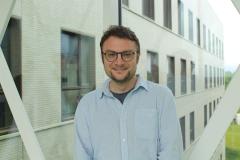
In the Metabolomics Core, Marco serves as the MSI specialist. He is integrating spatial dimensions into tracer metabolomics workflows. His expertise is key in developing and implementing novel methodologies to enhance the resolution, accuracy, and clinical relevance of metabolomics research.
Program
Mass Spectrometry imaging: principles, Sample prep and MSI instrumentation, theory of MSI data analysis
Theory on MSI data analysis / introduction to Shiny Cardinal
Lunch (provided)
Hands-on with Shiny Cardinal
Coffee break (provided)
MSqRob for downstream analysis of spatial data
Introduction on ISOscope software for spatial tracer metabolomics
Q&A session
Practical info


05 March 2027
Leuven - Campus Gasthuisberg
Herestraat 49
3000 Leuven
Belgium
05 March 2027
Leuven - Campus Gasthuisberg
Leuven train station is approximately 4 km from the campus Gasthuisberg. Buses depart very regularly to the Gasthuisberg Campus from Leuven train station.
For tickets and up to date schedules visit website De Lijn or use the De Lijn App.
Exit at the very last bus stop ‘Gasthuisberg Campus) make sure not to exit at ‘Gasthuisberg Kliniek =
hospital)
Once you get off the bus, go to your right and go up the street until you see stairs to your left. Climb the stairs all the way up between two buildings. Look for the signs containing blue circles and white numbers and follow them all the way from 2 up to number 12. You will cross several buildings and the walk will take max. 10 minutes. When you reach number 12, you have reached O&N 5, where you can find the reception.
05 March 2027
Leuven - Campus Gasthuisberg
The Gasthuisberg campus is west of the Leuven ring. Our buildings are situated behind the hospital (see black arrow near ‘RING NOORD’ on the map). If you come from the city center, you will arrive on campus from the east side (taking Mgr. Van Waeyenberglaan and roundabout Het Teken). If you come from Heverlee or Campus Arenberg, you will arrive from the west side (taking the Celestijnenlaan and Taborweg). When you arrive uphill at the intersection with the Rega Institute and the Red Cross building, you need to take the road down to the bicycle parking at Rega Institute (see map) where you can park. Next, follow the ‘Onderwijs & Navorsing blue route’ description below (start point is #9).
05 March 2027
Leuven - Campus Gasthuisberg
You arrive via the E314 highway – EXIT 16
After 200 m, keep left to drive underneath the roundabout and into the tunnel.
Keep left and follow the arrows to Parking West.
You arrive via the Leuven ring road
At the roundabout, take the exit towards ‘Spoed / Ziekenhuis’.
Follow the ring around Campus Gasthuisberg and pass the entrance of SPOED.
Continue right until you arrive at a second roundabout.
Follow the directions for E314.
Near the Fire Brigade Station, make a U-turn and follow the directions for ‘Ziekenhuis’.
Keep left and drive downhill, underneath the roundabout and into the tunnel.
Keep left and follow the arrows to Parking West.
Next, leave the parking at level +1 using the big stairs near the vending machines.
Follow the red carpet and arrows to 'Onco Dagcentrum' to get to the O&N buildings. Take the stairs on your left after exiting Parking West. You are now in front of the O&N4 building; on the left you will find O&N5.